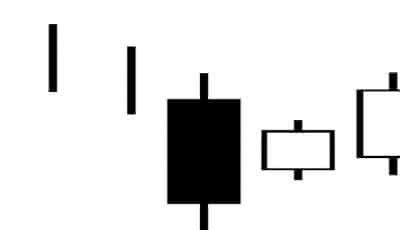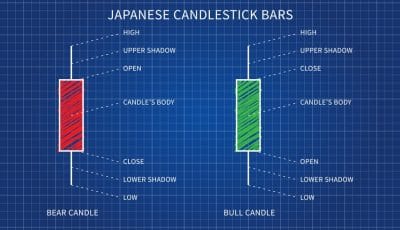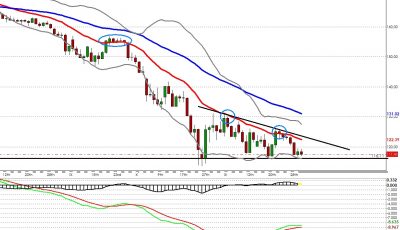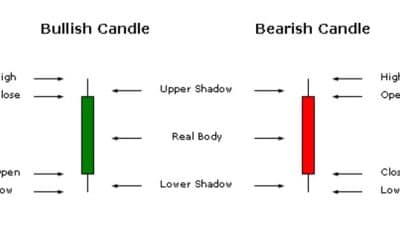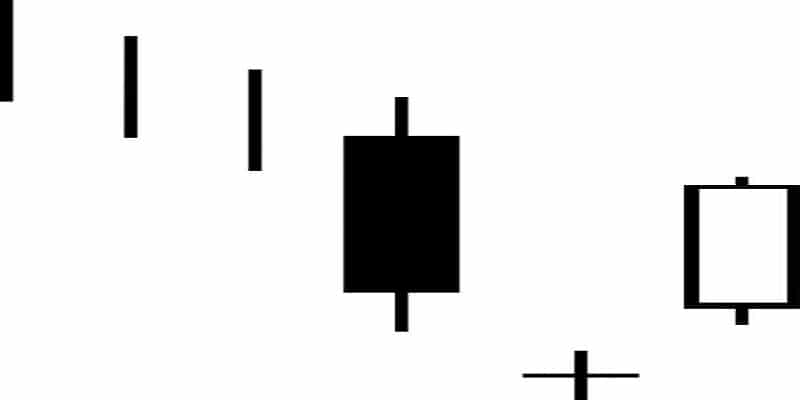
Bullish abandoned baby candlestick pattern is often observed when the market is ready for drastic reversal. It is very easy to recognize. First, the market is taking a generally downward direction at the time. On the first day of this three day pattern, there is a long black candlestick that appears to be a continuation of the current pattern.
The second day, however, holds a surprise, with a doji that begins at a gap down and has wicks that don’t touch the previous day’s wicks. This separation is impressive enough to demand attention on its own, but the third day only adds to the drama. On the third day, there is a significant gap up, ending with a white candlestick that also does not have wicks overlapping with the second day’s doji.
The meaning of the bullish abandoned baby candlestick pattern is clear. While the gap down on the second day seems to bode well for the bears, the market has hit its floor and simply cannot go down any further. The buyers take over at the doji and begin to push the price upward. The gaps between the days followed by the quick rebound is further proof that the turnaround is indeed happening.
Your Next Move
The bullish abandoned baby is considered very reliable because it is a confirmation of the bullish doji star, so your next move should be to buy into this market for maximum profit. However, many traders prefer to wait for further confirmation on the fourth trading day. The chances are good that this market is at the beginning of a long bullish trend, so this one day should not make too much difference.
Confirmation
Confirmation of the bullish abandoned baby candlestick pattern could consist of a gap up on the fourth day, an even higher close, or any kind of white candle. Special attention should be paid if the closing price exceeds the opening price of the first day.
Variations of This Pattern
The further the upward movement on the third day, the more this pattern suggests a reversal. This candlestick pattern is similar to other doji patterns and has the same meaning. The doji always suggests a trend reversal, and this is no exception to that rule.
Similar Patterns
The bullish abandoned baby candlestick pattern is a mirror image of the bearish abandoned baby. The key difference lies in the market conditions (bullish vs. bearish) and the candlestick colors (black vs. white). However, both suggest a complete reversal. This pattern can also be a continuation of the bullish doji star, confirming the reversal that is suggested by the doji of the second day. In any case, all of these candlestick patterns suggest the same future: a reversal in trend.
If you are seeing this pattern, you are watching the turning of the tides. You are lucky to catch this pattern, because it is likely to earn you profit and give you the bragging rights of being one of the first to invest in the next big thing.
