Category: stock analysis
Once a figment of imagination, and now a reality (ironically), virtual reality (VR) has garnered great interest over the years. With the introduction of VR headsets in 2016, VR …
Are you waiting for a stock to hit rock bottom? If so, you should be watching for the three outside down candlestick pattern. This formation is a reversal signal …
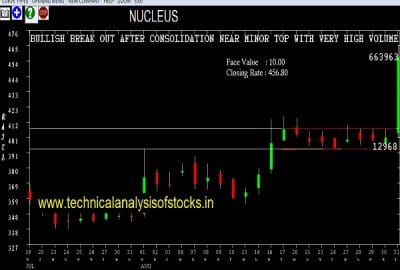
Volume is a measure of a company’s liquidity. Basically, it is the amount of shares that get bought and sold throughout a day compared to other stocks. In general, …
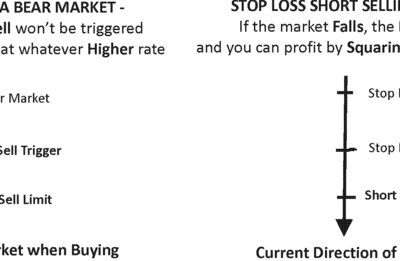
A stop-loss indicator is simply a price level at which traders should sell stock to prevent loss and maximize profit. This indicator varies from market to market and even …
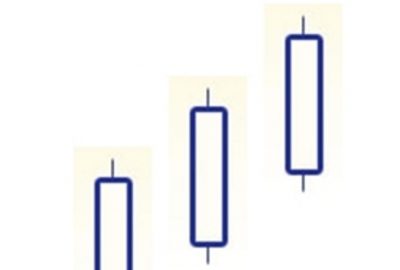
The three white soldiers candlestick pattern is an unusual one because its significance depends on its context. However, the pattern itself is easy enough to recognize. This formation simply …
Reading Bars Reading bars is one of the most popular methods of charting and financial market analysis, second only to candlestick charting. This method is popular because the simple …
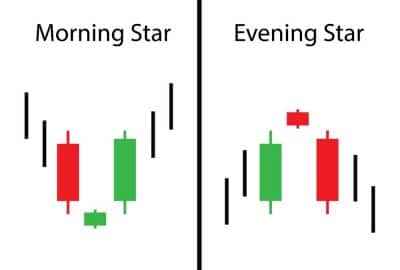
Are you getting tired of a downtrending market? Are you wondering when it is going to end? If so, the morning star candlestick pattern is one formation to watch …
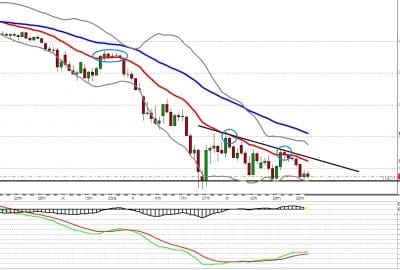
Technical Analysis Technical analysis is a way of using market data to predict the future of the stock market. Many of the principles of technical analysis have been developed …
Every stock trader in the marketplace globally that I know, they all have just one objective- to make money. However, very few people are able to successfully make money …


