Category: stock trend analysis
Algorithmic Trading has taken the domain of trading into the next generation. It is bringing several opportunities for traders. It is said to increase horizons to achieve optimum results …
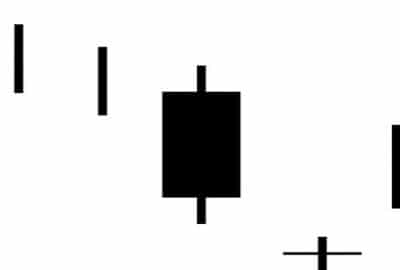
Bullish abandoned baby candlestick pattern is often observed when the market is ready for drastic reversal. It is very easy to recognize. First, the market is taking a generally …
Are you waiting for a stock to hit rock bottom? If so, you should be watching for the three outside down candlestick pattern. This formation is a reversal signal …
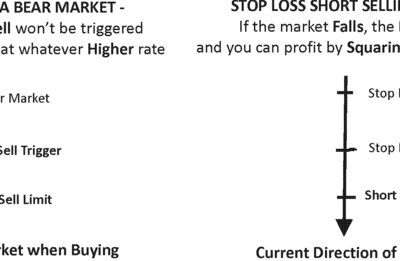
A stop-loss indicator is simply a price level at which traders should sell stock to prevent loss and maximize profit. This indicator varies from market to market and even …
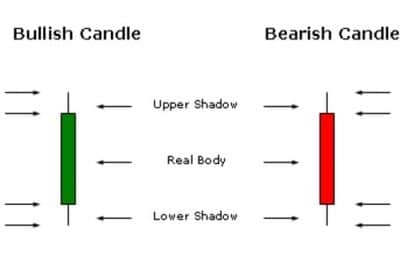
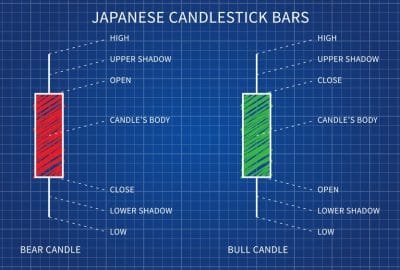
A typical candlestick is made up of a parts: the body and the shadow. A candlestick shows us a price bar with an opening price, a closing price, a …
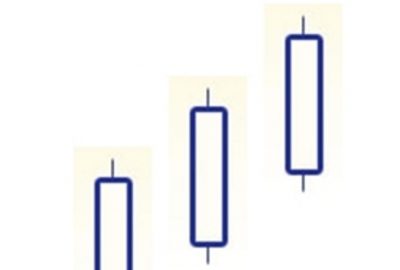
The three white soldiers candlestick pattern is an unusual one because its significance depends on its context. However, the pattern itself is easy enough to recognize. This formation simply …
Reading Bars Reading bars is one of the most popular methods of charting and financial market analysis, second only to candlestick charting. This method is popular because the simple …
If you are trading or thinking of getting into trading, Technical Analysis or TA is a very important part of the process. With out looking into Technical Analysis and …
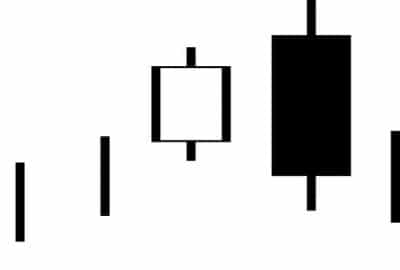
The three outside down candlestick pattern occurs during a bullish market. It begins with a short white candlestick on day one, but the second day comes with a surprise. …
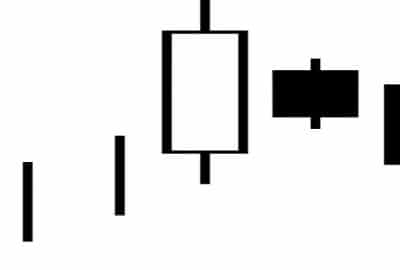
The three inside down candlestick pattern signals the end of one trend and the beginning of another. The movement that is about to end is a bullish uptrend that …

